SoX: How to Create an Audio Spectrogram
Updated
Learn how to create an audio spectrogram using SoX
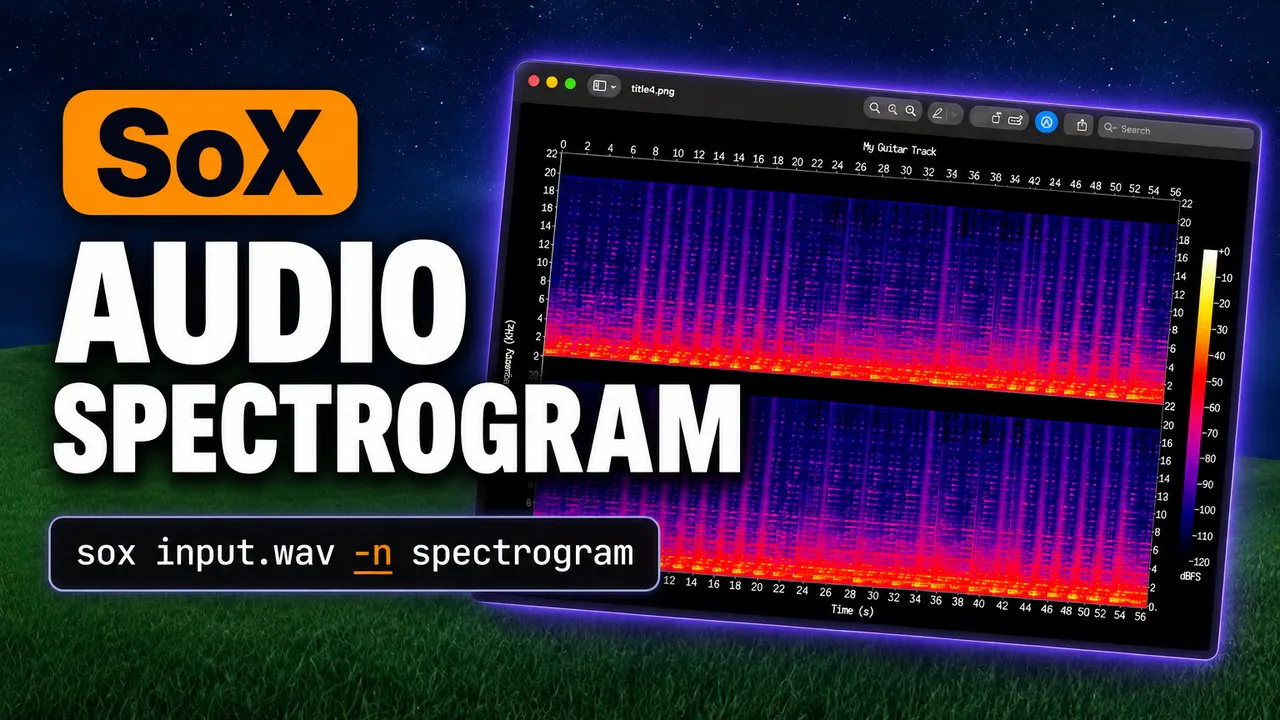
Before we get started, make sure you have Homebrew installed and an audio file ready to go, such as a WAV file.
First, open your Terminal by pressing command + space, typing Terminal, and hitting enter. Install SoX using Homebrew by running:
brew install sox
This might take a minute to download and set up, so just wait until your command prompt returns.
Next, use the cd command to navigate to the folder where your audio file is saved. Once you are in the right folder, run this command to generate your spectrogram:
sox input.wav -n spectrogram -o spectrogram.png
Just replace input.wav with your actual file name. Notice the -n flag in the middle; that tells SoX not to output a new audio file, since we only want the image.
If you want to add a custom title to the top of your image, just include the -t flag at the end like this:
sox input.wav -n spectrogram -o spectrogram.png -t "My Title"
To confirm everything worked, run open spectrogram.png to view your new image. You should see a detailed visual chart showing your audio frequencies over time.
You can customize the exact pixel size of your chart by adding -x for width and -y for height right after the spectrogram keyword.